Filtered Statistics
Filtered Statistics
For me, tuning the Microsoft Data Platform and SQL Server is a simple principle, make the engine do as little work as possible. For the engine and the optimizer to be able to do so, we need to feed it the appropriate information.
The SQL Server Cardinality Estimator(CE) does it’s best to analyze our data, structures and map the best available plan to retrieve the information that we need. To be able to do so, it is helpful for us to give the engine a guiding hand.
Execution plans for a procedure or ad-hoc query are created on the first time running the query. This means that we are at the mercy of the first process running the query. When this happens, the optimizer will analyze many bits of information, including the statistical distribution of the indexes. SQL Server will create the execution plan based on the parameters passed after the creation of the procedure. Based on the statistics, this plan could be sub-optimal.
There are MANY different methodologies to possibly implement for to give SQL Server a nudge, but one of them is Filtered Statistics. This is when we can tell SQL Server to generate statistics on a set of information. For example, we can compare Nashville Predator playoff statistics to Pittsburgh Penguin Playoff statistics. This will cause the CE to choose something to appease both.
While the CE is rather “intelligent”, we still need to help it along. We can give the optimizer a nudge in the right direction by creating Filtered Statistics. Filtering the statistics, with a where clause, will give SQL Server a subset of rows that gives the optimizer that nudge.
Create table objects
Below we will create the base table objects. In this exercise, we are tracking employee complaints.
/**************************************************************************************
** drop and create tables
**************************************************************************************/
        USE     AdventureWorks2012
        GO
        IF      OBJECT_ID('Employee') IS NOT NULL
                DROP TABLE Employee
        GO
        IF      OBJECT_ID('Complaints') IS NOT NULL
                DROP TABLE Complaints
        GO
        CREATE  TABLE Employee
                (
                EmpID           INT             ,
                name            NVARCHAR(100)
                )
        GO
        CREATE  TABLE Complaints
                (
                EmpID           INT             ,
                ComplaintsCount INT             ,
                RecordDate      DATETIME
                )
        GO
        CREATE CLUSTERED INDEX cidx_EmpID ON Employee(EmpID) with(data_compression = page)
        GO
        CREATE INDEX ix_Employee_name ON Employee(name) with(data_compression = page)
        GO
        CREATE STATISTICS ix_Employee_EmpID_name ON Employee(EmpID, name)
        GO
        CREATE CLUSTERED INDEX ix_Complaints_id_amount ON Complaints(EmpID, ComplaintsCount) with(data_compression = page)
        GO
Populate Data
Now, let’s populate the complaints. FlipFlops is a stellar employee, Sunshine should be fired and Wolf is on thin ice.
/**************************************************************************************
** Populate tables
**************************************************************************************/

        set     statistics time, io off

        INSERT  into Employee(EmpID, Name)
        VALUES  (1, 'FlipFlops')

        INSERT  into Employee(EmpID, Name)
        VALUES  (2, 'Sunshine')

        INSERT  into Employee(EmpID, Name)
        VALUES  (3, 'Wolf')
        GO
        SET NOCOUNT ON
        -- few complaints
        INSERT  Complaints VALUES(1, 100,GETDATE())

        -- He should be fired amount of complaints
        DECLARE @loop INT
        SET     @loop = 1
        WHILE   @loop <= 500000
                BEGIN
                        INSERT  Complaints(EmpID, ComplaintsCount, RecordDate)
                        VALUES  (2, @loop, GETDATE()-RAND()*1000)

                        SET     @loop = @loop + 1
                END
        GO
        -- He's on thin ice
        DECLARE @loop INT
        SET     @loop = 1
        WHILE   @loop <= 70000
                BEGIN
                        INSERT  Complaints(EmpID, ComplaintsCount, RecordDate)
                        VALUES  (3, @loop, GETDATE()-RAND()*1000)

                        SET     @loop = @loop + 1
                END
        GO

        UPDATE STATISTICS Employee WITH fullscan
        GO
        UPDATE STATISTICS Complaints WITH fullscan
        GO
SentryOne Plan Explorer
Upon writing this blog, I am not an employee of SentryOne nor do I endorse them in any official capacity. However, I will use SentryOne Plan Explorer over SSMS builtin any chance that I get. Therefore, the comparison images in the remainder of the document come from SentryOne. You’re Welcome.
Query data with NO filtered statistics
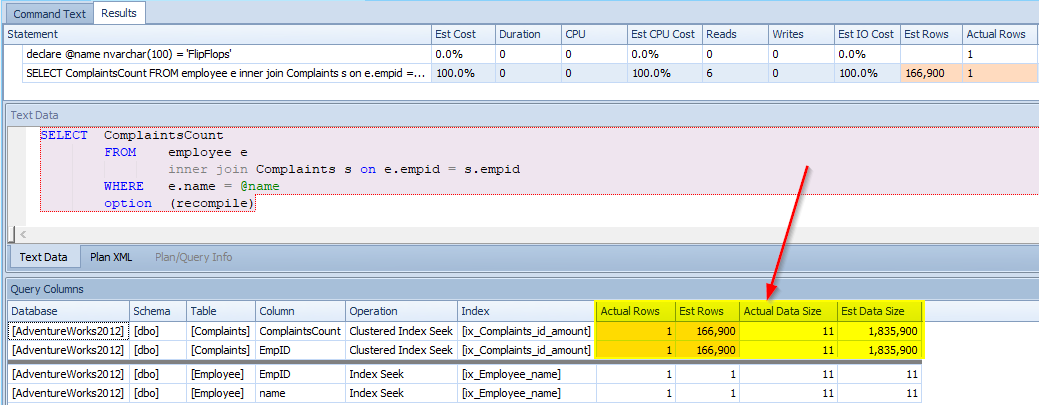
First, let’s look at FlipFlops with no filter.
        declare @name   nvarchar(100) = 'FlipFlops'

        SELECT  ComplaintsCount
        FROM    employee e
                inner join Complaints s on e.empid = s.empid
        WHERE   e.name = @name
        option  (recompile)
In the image below, we see that although only ONE result was returned, CE estimated 166,900 records. Not quite fair to guess that he has caused so much trouble when he has not.
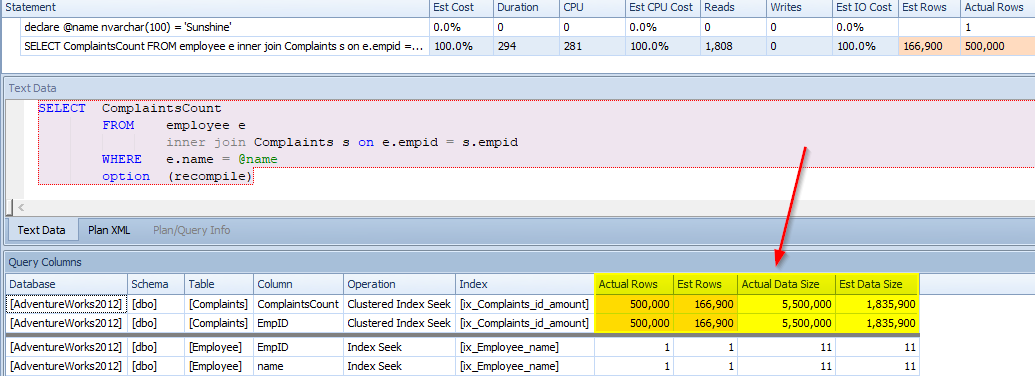
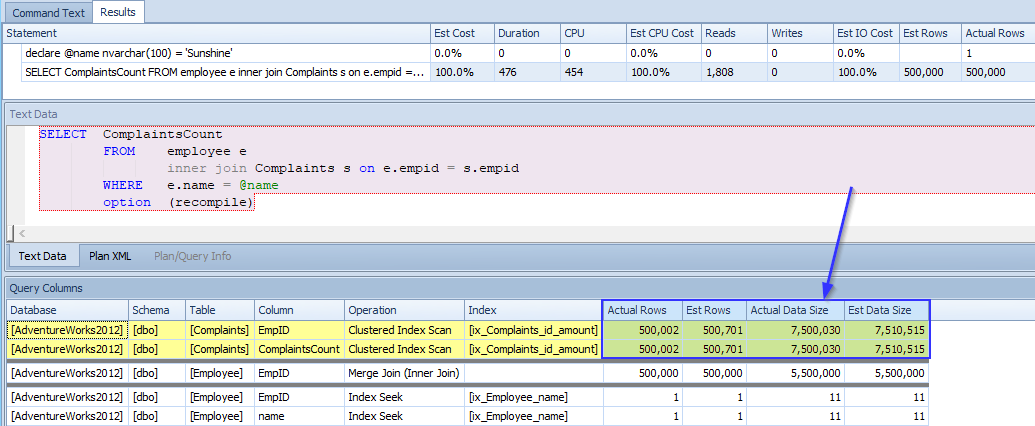
Now let’s see Sunshine. Remember he had 500,000 complaints! It must be his cheery misdemeanor.
        declare @name   nvarchar(100) = 'Sunshine'

        SELECT  ComplaintsCount
        FROM    employee e
                inner join Complaints s on e.empid = s.empid
        WHERE   e.name = @name
        option  (recompile)
When we look below, although he had 500,000 complaints, only 166,900 records were estimated for return.
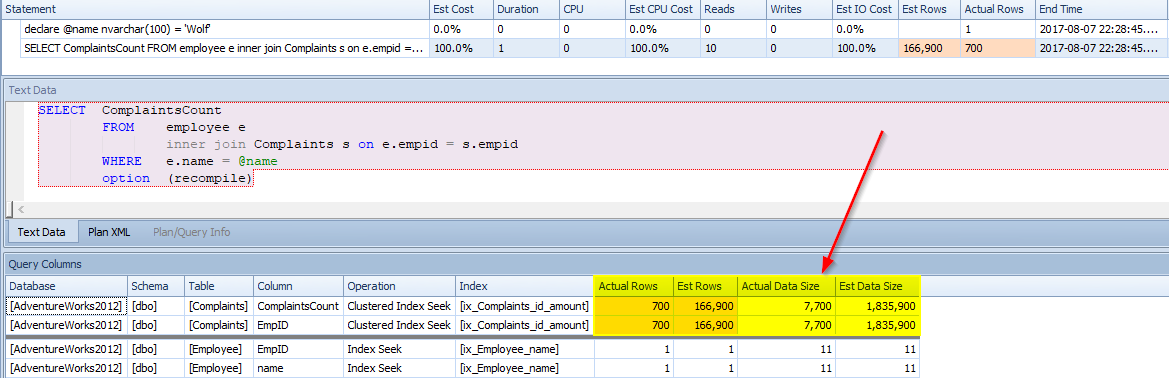
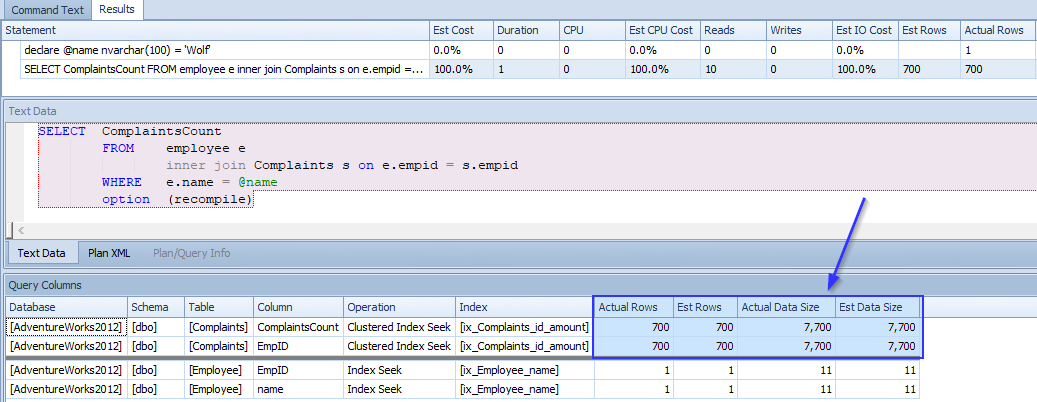
Finally, let’s checkout Wolf. While he could be worse, he is on thin ice. He has 700 complaints.
        declare @name   nvarchar(100) = 'Wolf'

        SELECT  ComplaintsCount
        FROM    employee e
                inner join Complaints s on e.empid = s.empid
        WHERE   e.name = @name
        option  (recompile)
Wolf only had 700 complaints, but 166,900 records were estimated for return. He is looking much worse than reality shows.
So, what is happening is that there are 3 possible employee results for complaints. It is rather simple. CE is taking the total amount of records(500,701) and dividing by 3 assuming that all 3 will have roughly the same amount of records. We see that along with the estimated number of records being the same, the execution plan operators are the same. For such a variation in amount of records, there must be a better way.
Implementing Filtered Statistics
This is where the “magic” happens. It really is not that complicated. Create Statistics on a column and have a where clause. However, there are some rules:
- cannot reference a computed column
- cannot reference a UDT column
- cannot reference a spatial data type column
- cannot reference a hierarchyID data type column
- use “Null” and “is not null” rather than NULL literals
        CREATE STATISTICS Employee_stats_EmpID ON Employee (EmpID)
        WHERE name = 'FlipFlops'
        GO
        CREATE STATISTICS  Employee_stats_EmpID2 ON Employee (EmpID)
        WHERE name = 'Sunshine'
        GO
        CREATE STATISTICS  Employee_stats_EmpID3 ON Employee (EmpID)
        WHERE name = 'Wolf'
        GO

        UPDATE STATISTICS Employee WITH fullscan
        GO
        UPDATE STATISTICS Complaints WITH fullscan
        GO
Results with Filtered Statistics
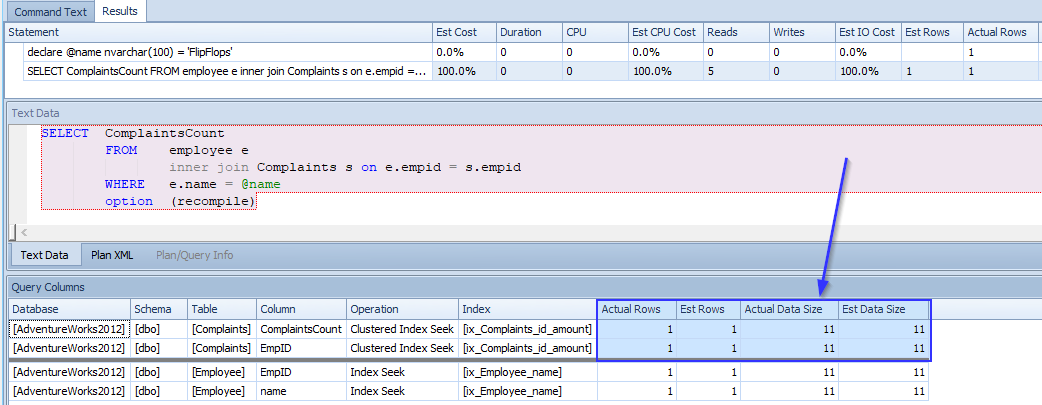
Let’s see FlipFlops to start
        declare @name   nvarchar(100) = 'FlipFlops'

        SELECT  ComplaintsCount
        FROM    employee e
                inner join Complaints s on e.empid = s.empid
        WHERE   e.name = @name
        option  (recompile)
Now we see that he has only one complaint estimated. We knew that he was alright.
Next Sunshine. Let’s see if the estimate is as high as the truth.
        declare @name   nvarchar(100) = 'Sunshine'

        SELECT  ComplaintsCount
        FROM    employee e
                inner join Complaints s on e.empid = s.empid
        WHERE   e.name = @name
        option  (recompile)
Again, this is what we would expect. The CE is estimating much closer to the reality. Also, take note of the join operator. For all of the other execution plans it is a nested loop. For this call, you will see the merge join operator. To this point, the execution plans have been using the nested loop operator, which is essentially a “for/next” loop. A merge operator brings together 2 one-to-many or many-to-many record-sets that are similar in size and order. Think of it like meticulously shuffling two ordered decks of cards. In this situation, this is a more efficient plan estimated by the CE.
The optimizer must know Sunshine personally.
Finally, Wolf again.
        declare @name   nvarchar(100) = 'Wolf'

        SELECT  ComplaintsCount
        FROM    employee e
                inner join Complaints s on e.empid = s.empid
        WHERE   e.name = @name
        option  (recompile)
700 complaints and the CE guessed 700. He might want to watch out.
Conclusion:
The SQL Server Cardinality Estimator does it’s best but is not perfect. Sometimes it needs a bit of a push. This comes with an understanding of the underlying data. If our data has a rather even distribution, the Filtered Statistics are not likely necessary. However, if we have data that covers many peaks and valleys, each varying, then Filtering Statistics may be a viable answer.
Play with them and leave comments and let me know what you find.
2 thoughts on “Filtered Statistics”